
One of my many failings is my inability to live tweet conference sessions. I mean that I just about manage to quote profound micro statements with an out-of-focus picture of a slide, but I generally have no idea what it meant two weeks later. Let’s see if I can make anything better from my 35 pages of scribbled notes.
LSAC 2018 took place on Monday 22nd and Tuesday 23rd October at the University of Amsterdam. These notes are thematic and not meant to provide a historical summary of the conference.
My colleague Emma and I presented our paper ‘Going beyond the pilot‘, essentially sharing some of the key findings from the ABLE & STELA projects.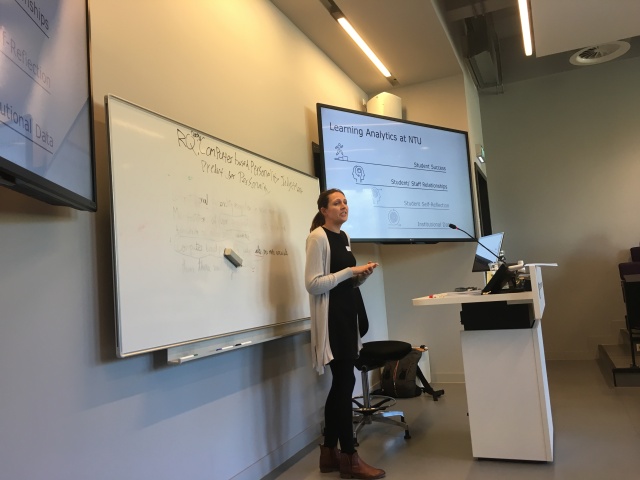
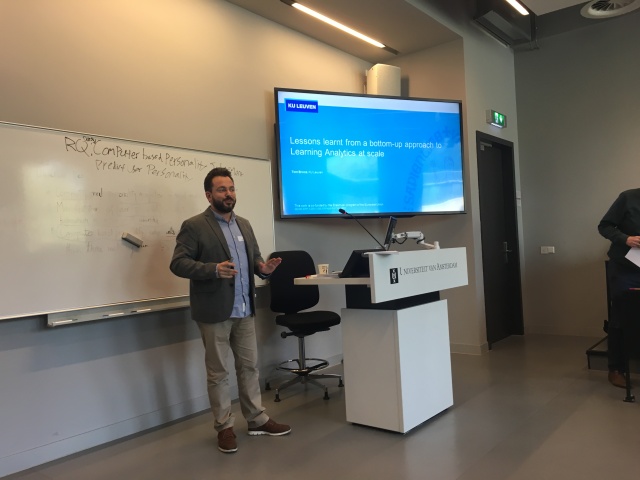
In our slot, we were joined by Tom Broos from KU Leuven presenting more a slightly more official end-of-project presentation on the STELA project.
- Learning analytics is an excellent tool for educational research. This is hopefully the most obvious statement I write, but Tim McKay’s keynote was primarily about the use of learning analytics as a research tool. Our work is very focused on using learning analytics to improve the system of student support. It was fascinating to see a data scientist stand back and ask questions about how they might use all that valuable data to improve learning and teaching.
- Data systems collapse complexity. In order to make data manageable, the rich and complex nature of the individual is reduced to simple labels: male/female, able bodied/ disabled etc. Such reductions trade efficiency for meaning. At my institution, we’ve got used to working with large data sets that show the inter-relationships between multiple socio-economic disadvantages, for example class and ethnicity (intersectionality), but it was interesting to see McKay quote a model for analysing the complexity of intersectionality (McCall, 2005)
- Note for me. I want to find out more about the approaches used in eCoach.
- Other note for me. I really can’t get on with panel discussions. I understand that they’re great for showcasing a diversity of voices (particularly students) and both sessions were well facilitated, but I just don’t find them useful.
- The real goal for diagnostic/ predictive early warnings is spotting students at risk early enough to be able to do something about it (obviously). Tom Broos put it brilliantly “Most learning analytics is designed to maximise accuracy. Why not design it to maximise actionability?” I’ve blogged about it before, but it’s a good instinct to keep in mind.
- Using learning analytics to analyse the relationship between student self-perceptions about procrastination produced complicated results. At the very least, some of the theories about procrastination may be challenged by actual student behaviour measured in learning analytics Dr Sophie Cormack
- Ian Dolphin provided a number of horror stories about misuse of data (similar in tone to Weapons of Math Destruction). He proposed models of best practice for openness in learning analytics. His framework has 8 elements:
- clear purpose for using data
- ethical framework
- open and inclusive governance
- open source software (access to the code)
- open platform/ architecture
- open standards
- open algorithms
- open consent/ consent management
- We don’t meet all of those criteria (we use a commercial vendor so the software isn’t open source for example), but it’s good food for thought. He also raised some interesting questions about the importance of equipping learners to be able to be both data and algorithm literate and that consent is likely to rise up the agenda with end users as the sector gets more used to learning analytics.
- I need to take a look from time-to-time at the Amsterdam Centre for Learning Analytics
- The impact of any learning analytics system is only as good as the staff or students who use it. The Free University of Amsterdam presented an randomised control trial where they provided study counsellors with an early warning system about students at risk of failing. Unfortunately there was no significant effect on student success, but loads of interesting questions. For example:
- Was the early warning system flawed?
- What is the actual evidence of the efficacy of the study counsellors in improving student success? Really interesting.
- We’ve been discussing the issues of adding more data sources to our learning analytics algorithm with our vendor Solutionpath. Another really interesting presentation from the Free University of Amsterdam got me thinking about the problem of overfitting: making the perfect model from the data you have, but the almost impossibility of making it fit for a different cohort. Also we have a problem to solve, our algorithm brilliantly identifies students who are highly at risk of early departure, but there is a large block of students who are somewhat at risk, but because there are so many of them they make up a large proportion of the students who actually drop out. However, there’s a problem that if we push them into a more serious risk category, then there are risks of demotivating students or generating lots of false positives.
- Possibly my favourite paper was from the University of Amsterdam. It showed that second year students in the study had a small but statistically significant improvement in their academic when presented with a dashboard showing them their predicted end-of-year credits. It appears that they responded well to predictions that their current study behaviour might not be quite as good as they expected.
- Next year’s conference is in Nancy 22-23 October 2019
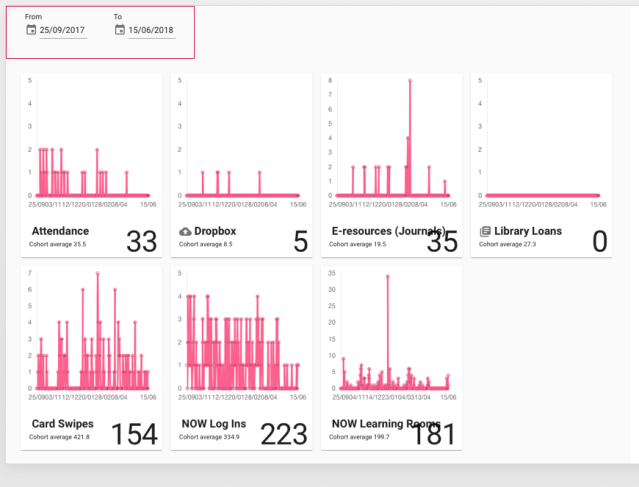
- Finally, we don’t make enough use of the previous year’s data in our Dashboard. The students can compare themselves to their peers, but we don’t overlay last year’s data onto their view. It would be really interesting to experiment with this idea, for example showing last year’s trends onto the current student graph. At present a tutor can compare the individual student with their peers (see graphs below), but we don’t particularly map that back to academic attainment.
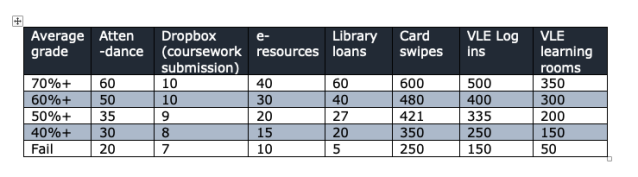
- What would be the consequence of showing the activity, but banded by academic attainment? (See made up table below) Clearly there are ethical issues of making students feel on a treadmill, or giving false assurance, perhaps this should only be used by tutors, but there’s something here.
Okay, so marginally more coherent than live tweeting.
