
The learning analytics resource we use (StREAM by Solutionpath) measures students’ engagement with their course using the proxy of their electronic footprint. Whilst we can’t measure what’s going on in their heads, we can measure whether or not they have attended classes, logged in to the VLE, taken out a library book etc. The data is represented in a number of ways, including a week-by-week graph showing overall engagement since the start of the year.
It’s not a perfect system. A student can buy their own textbooks instead of borrowing them from the library, or they might watch the lecture online instead of turning up in person. However, there is a very strong association between engagement and success. In essence students who do more, generally do better. Our studies show that time on task is a better predictor of success than background or entry qualifications.
Let me qualify that.
Average engagement for the year is a better predictor of success than student background or entry qualifications. Typically students about 95% of students with ‘high’ average engagement complete the first year, as do 92% of students with ‘good’ average engagement. Around 80% of students with ‘partial’ average engagement complete the year as do around 20% of students with ‘low’ average engagement. We have recently started working on a ‘very low’ category and will do the analysis shortly.
What is the ‘right’ engagement to look at? At what level of detail do tutors need information?
Average yearly engagement?
In the diagram below, the student has an average partial (P) engagement. 
Average engagement is a really useful way to check the quality of the algorithm. But it’s fundamentally flawed as a trigger for intervention. We have come to rely on it as a quality measure, but it’s problematic. Nobody can intervene based on a measure only available at the end of the year.
Average engagement for the year is accurate, but it’s not timely enough and it masks an enormous amount of variation. The typical undergraduate year runs from the third week in September to the first week in June (approximately 260 days). There will be a huge variation between a students’ engagement on any given day. In the run up to coursework deadlines, engagement typically rises, immediately afterwards it drops and of course it’s likely to be lower at weekends and holidays.
Average weekly engagement?
So if we take the same student and add in their average weekly engagement it will look something like as follows:
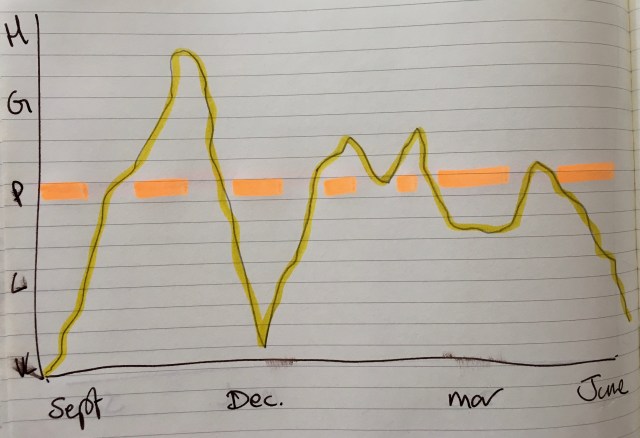
Engagement typically rises at the start of the year, drops off over Christmas, picks up again in January, drops off over Easter (but not as much as at Christmas) and tails off in the final term. It is completely shaped by deadlines, a student’s own motivation and interest in the topic. Weekly average engagement gives a good overview of how a student is engaging with their course.
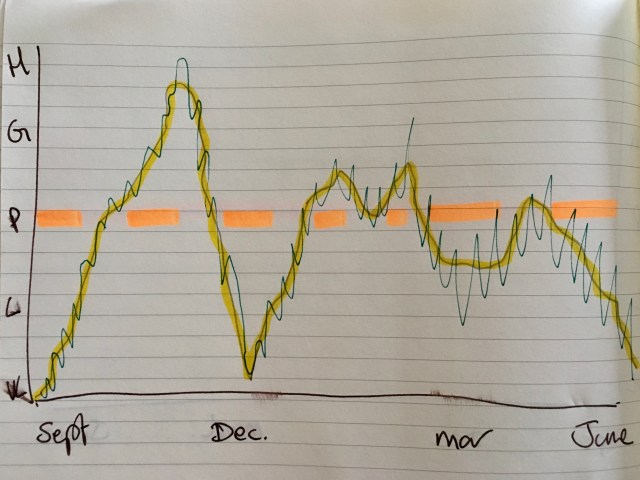
Average daily engagement?
However, we can add further detail. If we add daily engagement (the badly drawn green line in the diagram below) we will end up with a far more granular picture. However, the question becomes ‘is it more useful?’.
For a tutor, the tests probably need to include:
- “If you looked at the graph on any given day, would it be useful?”
- “Right now, does this give you a good enough understanding of risk?”
So what’s the right level to look at?
- Clearly, yearly is unhelpful. We can only get this picture a long time after it’s too late to intervene for a student.
- Daily also feels wrong. I don’t think that anyone could reasonably expect a tutor to be able to interpret a daily engagement score for all the students they are responsible for. It’s too close. Tutors need to be able to metaphorically stand back to take in a bigger picture.
- Is weekly right then? Probably. But probably not in isolation. I think we need to also look at other data points including: average grades/ or another measure of academic success (passed/ failed modules?), course average engagement and possibly each individual element that builds up the engagement score.

Pingback: Thoughts & lessons from LSAC 2018 (22nd – 23rd October 2018, University of Amsterdam) – Living Learning Analytics Blog