
I’ve spent the past week thinking (probably overthinking) about this. So I’ve written up a modified learning analytics cycle. Obviously it starts with Doug Clow’s model as discussed in the last entry. However, I’ve added details about the institutional infrastructure and decision-making needed to actually enable learning analytics to happen.
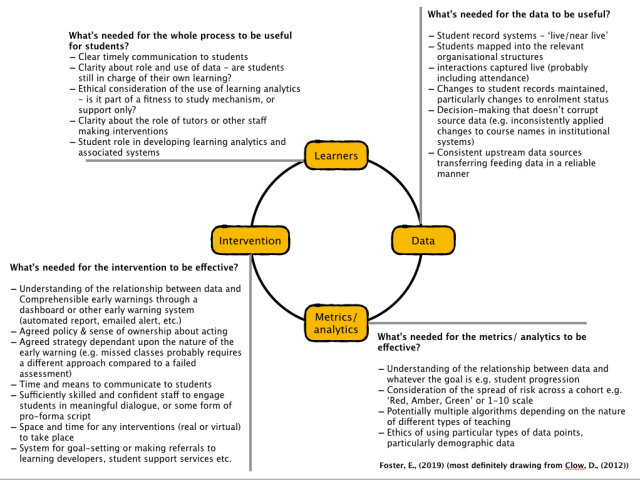
Each of the branching arms shows a set of criteria needed to make the learning analytics cycle work, many were identified in the ABLE and STELA projects. I’m just going to pick out a couple
Students: Clarity about their own role in the use of data
One of the issues that arose in a recent meeting with our Students’ Union was the impact of learning analytics on the agency of the student. Students had asked essentially “if the Dashboard is looking out for me, and a tutor will check up on me if I don’t do any work, what am I responsible for?” I was intrigued and a little horrified. Staff are expected to support students, but from the start our students have access to the Dashboard, they are expected to use it to self-regulate their own learning.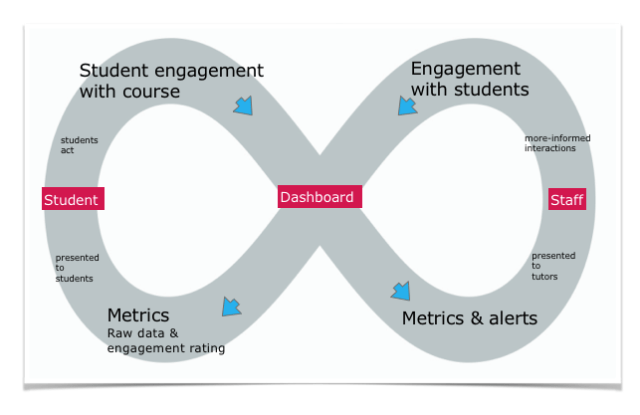
Data: Decision-making that doesn’t corrupt source data (e.g. inconsistently applied changes to course names in institutional systems)
Partway through the ABLE Project (2015-2018) in an organisational re-structure, an organisational unit name got changed, an ‘and’ was replaced with ‘&’.
And it broke the Dashboard.
For a while and just for those students. But it broke the Dashboard because the tool was trying find students in a particular data bucket and of course that bucket no longer existed. No-one made a bad decision, but there’s a chain that starts with a management/ marketing/ branding/ preference-based decision that leads to an administrator making a change on a database somewhere and then ‘boom’ the students data suddenly looks wrong in the Dashboard.
Our project partners laughed. A lot.
And then someone added a comma to the name of a course on a spreadsheet and someone else’s learning analytics tool broke.
The quality of data needed in learning analytics is off-the-scale compared to normal institutional practices.
Metrics/ analytics: Consideration of the spread of risk across a cohort e.g. ‘Red, Amber, Green’ or 1-10 scale
I’ve already described that I’m not a data scientist, but I work with a very good one. We use learning analytics to ultimately promote student success. We tend to define success by progression to the next year of study (particularly the second) and academic attainment. How we define risk becomes really important. The NTU Student Dashboard uses five daily engagement ratings: High, Good, Partial, Low and Very Low. Each category relates to essentially the likelihood of a student progressing from the current year to the next based on average engagement, and for the sake of clarity, our modelling work is based on first year students. For example, students with high average engagement have a higher than 95% chance of progressing to the next year of study. Setting the distribution becomes a real balancing act.
Ideally, we want as many students in the extremes because this makes the data more actionable for a tutor, however our students can see their own engagement data. We need to be careful not to push students into the ‘low’ and ‘very low’ categories unnecessarily in case we demotivate students. Similarly, most of our students are somewhere in the middle, so what do we do about them?
Interventions: Sufficiently skilled and confident staff to engage students in meaningful dialogue, or some form of pro-forma script
I’ve been an advocate for personal tutors to be the primary point of contact in the Dashboard. I think that their role integrated into the course is important, but there are other models, Study Advisers, or even call-centre models. Nonetheless, the staff conducting the intervention need to be sufficiently skilled to make the initial contact, early interventions and referrals if necessary.
I hate to think how complicated the model will look by next weekend.
