
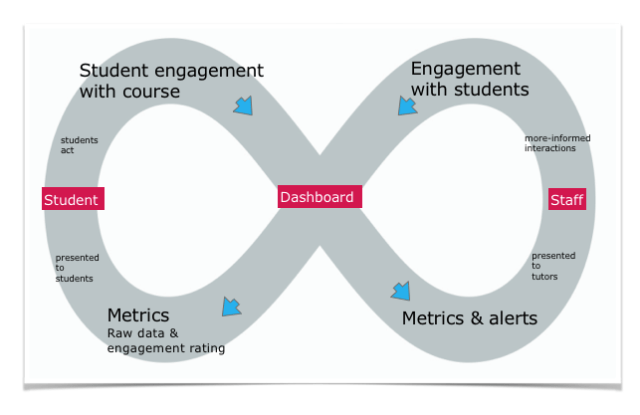
If students are to use learning analytics to change their own behaviour, we need to find ways to communicate the need to change to them. Our fundamental model of learning analytics is that the learning analytics resource generates opportunities for both students and staff to regulate or even moderate their engagement.
- Students do this by reflecting on data such as “high engagement” or the relative position in comparison to peers on the course.
- Staff can intervene by looking at the data, but also through functionality such as automated alerts
 However, we’ve recently uncovered something interesting about how male and female students perceive the Dashboard that I think requires further consideration.
Remember the blue dress meme from 2015?
For a few weeks the photo on the left circulated throughout social media with people debating whether or not the dress was blue/ black or white/ gold. For what it’s worth, it’s apparently definitively blue/ black.
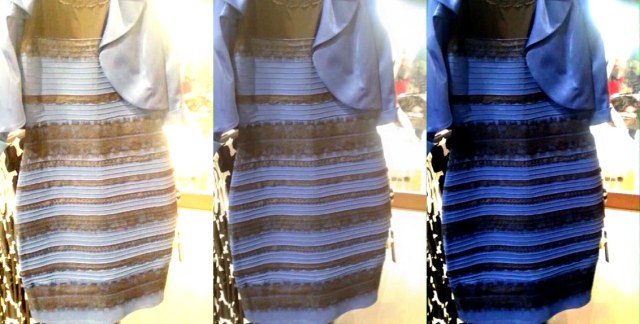
The blue dress meme is interesting on lots of levels (subjectivity of perception, how difficult it can be to comprehend another person’s perspective, but also how utterly convinced we are that we are ‘right’).
I’ve blogged before about how data is probably less good at changing behaviour than we might like. I’d like to return to the theme. One of the problems for learning analytics is that we are all likely to see the same data and place different meaning on it. This difference might be very large for male and female students.
We’ve noted before in our HERE Project work that men and women are very different in the way that they perceive the risks of early departure. In 2011, we wrote about some of the differences between male and female students’ experiences in a chapter of Male access & success in Higher Education: a discussion paper. The typical male respondent regarded their studies quite differently to the typical female respondent.
Only 44% of male students reported that they had worked hard so far in the year, compared to 62% of female students.
They felt more distant from teaching staff and found feedback less useful. They were less likely to prioritise their studies than their female peers. Despite being apparently less engaged with many aspects of their studies, only 31% of male students had considered leaving compared to 41% of female students. We asked permission to track their progression: 97% of females progressed compared to 94% of male students.
In the 2018 transition survey males and females once again appeared to differ in their answers to a number of key questions. Male students appeared to be enjoying themselves more, were more confident than their female peers, yet felt less engaged than their female peers in their studies.
We also asked about how students reacted to the Dashboard. In 2018, 61% of students felt ‘confident’ or ‘very confident’ after logging in to the Dashboard and 55% felt ‘motivated’ or ‘very motivated’. However, males were more confident after logging in than their female peers (65% compared to 58%) but were less motivated to study further (53% compared to 63%). What makes this more fascinating is that male students typically have lower engagement than their female peers, are more likely to drop out early and less likely to achieve good grades.
On average then, male students appear to be taking flimsier evidence that they are doing well as confirmation that they are going to be fine.
I find this fascinating.
It also makes design really problematic.

Pingback: Onwards from Learning Analytics (OfLA) – Living Learning Analytics Blog