
Student Engagement drives the learning analytics resource we use. That is, we count students’ use of various electronic proxies that are associated with participation on a course.
However, before discussing those, I want to explore the concept of student engagement. In the UK there are broadly three definitions of student engagement:
- Students engaging with the academic activities of their course
- Students engaging in the quality management processes of their course/ institution (particularly pushed by the former Quality Assurance Agency)
- Students engaging with the wider student experience, particularly involvement in Students’ Union and volunteering opportunities
I’m going to focus on just point 1.
Students engaging with their courses
Some of the earliest writing on engagement comes from the US. To a large extent these models still dominate the academic landscape. These ‘College Impact models’ (Pascarella & Terenzini (2005, pg. 52) are sociologically based and designed to explain the student learning experience. Astin (1985) originally described this activity as ‘involvement’ and Tinto (1993) ‘integration’, but from the 2000s onwards, the sector appears to have settled on calling this range of activity ‘engagement’. Probably the most widespread definition is that of Kuh et al (2008, pg. 542) who state that “Student engagement represents both the time and energy students invest in educationally purposeful activities and the effort institutions devote to using effective educational practices.” Kuh’s work led to the creation of the National Survey of Student Engagement (NSSE) which measured students’ self perceptions of how engaged they were with key aspects of their courses. Kuh found that the survey had some predictive power for showing the likelihood of student progression, but that it was weaker than background characteristics.
Although NSSE arises from the context of college impact models, it can be viewed as quite individualistic and even behaviourist. There is a strong European and Australian counterpoint to the view of engagement described in the NSSE. Writers such as Solomonides, (2008, 2012), Bryson & Hardy, (2008, 2012, 2014a, 2014b) and Zepke & Leach, (2012) suggest that Kuh’s interpretation of student engagement may be too narrow and doesn’t give due consideration to factors such as intrinsic student motivation, their personal life and their sense of self. Bryson (2014b) in particular makes for a strong argument about the student engagement ‘black box’. Student engagement is dependent upon a combination of factors some of which will be unknown (and unknowable) to the student within a context of interactions with the institution, students, family and the political, cultural and socio-economic forces at play in the wider society.
I personally find Harris et al’s (2004) model of student engagement useful, particularly for those interested in learning analytics. Harris et al argue that student engagement has four dimensions:
- cognitive
- affective
- relational
- conative (time on task)
Time-on-task is often studied using attendance as a measure of engagement. High student attendance at timetabled classes is strongly associated with high levels of attainment (Romer, 1993, Colby, 2004, Burd & Hodgson, 2006, Newman-Ford et al, 2008). Farsides & Woodfield (2003) reported that “application, specifically seminar attendance was by far and away the strongest and most consistent predictor of academic success” (pg.1239). It might reasonably be expected that this simply reflects the fact that ‘better’ students are better motivated and acculturated to successful learning in higher education. However, Romer (1993) found that if academically successful students were also regular attenders they performed better. Woodfield, Jessop & McMillan (2006) found several personal characteristics associated with academic success (e.g. extroversion, conscientiousness, high A level points, etc.) however, attendance acted as a multiplying factor for improving attainment, particularly for male students.
Student Engagement and Learning Analytics
I’d argue that there are four sources of raw data for any learning analytics associated with student success (whether descriptive or predictive) and a fourth category with interesting potential (1). They are:
- Student characteristics (socio-economic background and entry qualifications)
- Student engagement (conative engagement with VLE’s, attendance etc.)
- Student achievement (academic grades)
- Student generated data (self-evaluation, surveys, notes, personal goals etc.)
Learning/ learner analytics has been proven a number of times to be able to identify students most at risk of early departure. It’s interesting that most institutions appear to have used a combination of the first three data sources.
Campbell, DeBlois & Oblinger (2007) describe a number of American colleges who have used learning analytics to improve retention. In these case studies, ‘at risk’ students are identified using a combination of factors usually including entry qualifications, personal characteristics (for example ethnicity, hours worked or the length of the commute to campus) and academic engagement (usually grades achieved, but also whether or not they had completed specific modules). Bogaard, et al., (2016), cite a number of examples from universities using a metrics from all three sources including the Purdue Course Signals. Kutieleh & Seidel (2015) found that using a mixture of academic performance, VLE log ins, applications data, and systems log in data, they were able to identify students at risk of early departure. Kuzilek at al (2015) found that the OU Analyse tool’s predictive accuracy was improved by adding student engagement data into the model.
Learning Analytics using only Student Engagement Data
As I’ve already described in Making the Dashboard less accurate: probably the best decision we made about learning analytics NTU chose to only focus on student engagement data. Arguably, we took a gamble on this, but given that this is a student-facing resource, this still feels the right decision, particularly as under GDPR, institutions may find that they have to explain their algorithms to students. The NTU Student Dashboard uses the Solutionpath StREAM tool and in the diagrams below used four data sources: VLE log-ins, door swipes, online submission and library loans. We have subsequently added attendance and e-resources.
The chart below shows the relationship between average engagement for the year and progression using the data from the NTU Student Dashboard. As might be expected, there is a strong correlation between engagement and progression. In 2015, we analysed the relationship between student engagement, demographic factors, entry qualifications and progression. The strongest predictor of success was whether or not a student had high average engagement.

Average engagement is also a strong predictor for academic achievement. The following box and whisker diagram shows the relationship between average engagement and academic success.
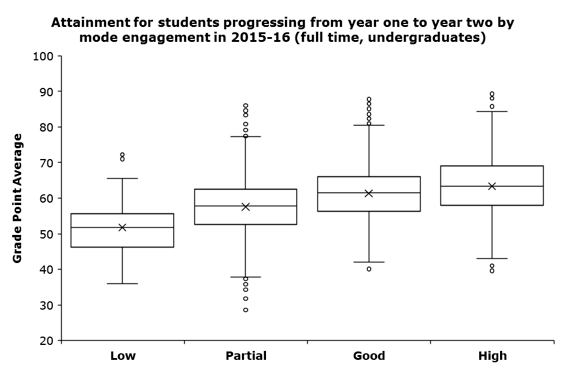
Student engagement is not a perfect predictor of success: highly engaged students still drop out, a tiny number fail their courses, but we’d argue that engagement provides a meaningful starting point for an informed dialogue with students. Our evidence suggests that student background does influence student engagement. More affluent students are more likely to have higher engagement than their widening participation students. But, it’s not predetermined, there are many widening participation students with high engagement. Unlike using background characteristics that focus on factors that students can’t change, focusing on engagement means that tutors and support staff can concentrate on behaviours that the student can change.
Summing it all up (well attempting to)
Students’ engagement with their studies has long been identified as a potential predictor of student success. Prior to the arrival of learning analytics, institutions were reliant upon time-consuming measures such as attendance monitoring (Colby, 2004, Newman-Ford et al, 2008) or large-scale student surveys (Astin, 1985, Kuh, et al., 2008). These systems worked, but they are potentially difficult to operationalise. For example building reports or early warnings. Learning analytics potentially allows the higher education institutions to identify students at risk of early departure sufficiently early to be able to intervene effectively.
(1) I’d argue that student generated data gives us potentially rich data but its’s also difficult to ensure that the whole cohort engages with it and so may be best used to provide additional insights rather than drive algorithms.

Pingback: Students in Transition: the challenges of becoming a first year student – Living Learning Analytics Blog
Pingback: Diagnosing student ‘risk’: categorising learning analytics to prevent early withdrawal – Living Learning Analytics Blog
Pingback: Student attendance/ engagement policies – why do we bother? – Living Learning Analytics Blog